Low-Volatility Upward Drift Breakdown Study (1H)
Research question (frozen): following a bearish impulse, does a low-volatility, gently upward-trending consolidation break below its frozen low before its frozen high within 12 hours at a materially higher rate than comparable consolidations?
Executive summary
- Primary cohort A: 95 of 556 resolved events (575 deduplicated events displayed) broke down first within 12h: 17.1% (95% Wilson CI 14.2%–20.4%; all-valid denominator 16.5%); breakout-first 82.9%; neither 3.3%; ambiguous 0.00%.
- Generic low-volatility consolidation baseline (no positive-drift requirement): 51.0% breakdown-first. Pattern minus baseline = -33.9% (95% block-bootstrap CI -38.3% to -29.3%).
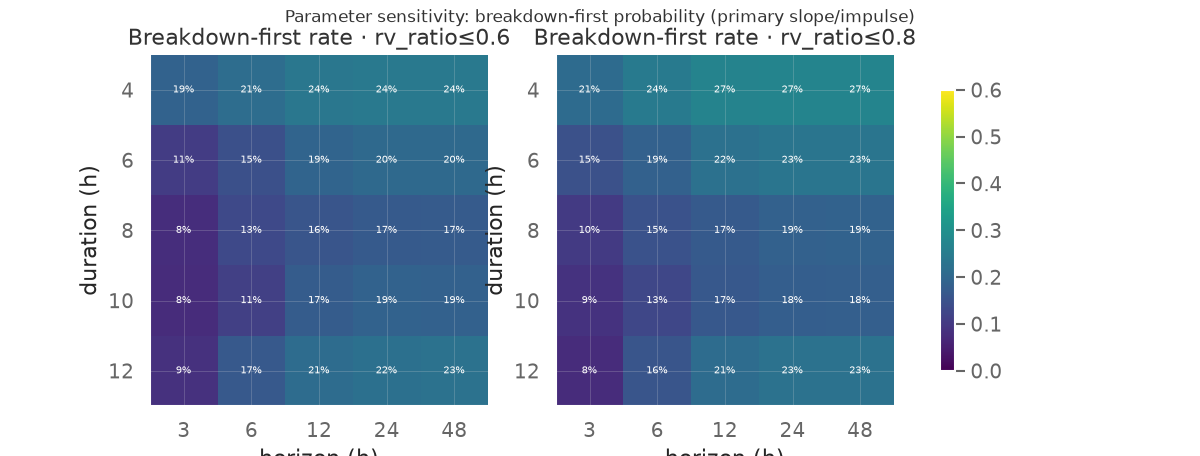
- Horizon curve (cohort A): 3h 10.3% · 6h 15.0% · 12h 17.1% · 24h 18.5% · 48h 18.8%.
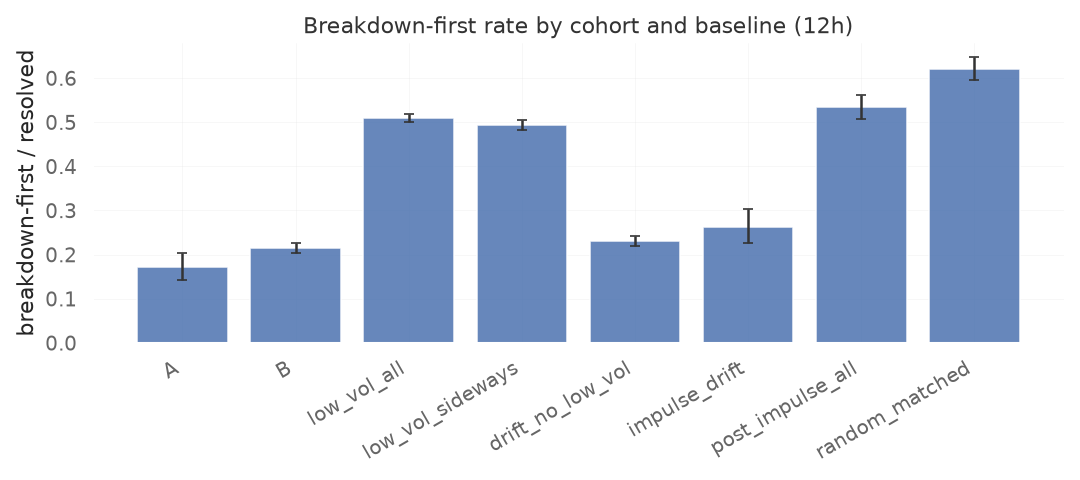
- 12h baselines: low_vol_all 51.0%; low_vol_sideways 49.3%; drift_no_low_vol 23.1%; impulse_drift 26.3%; post_impulse_all 53.4%; random_matched 62.2%.
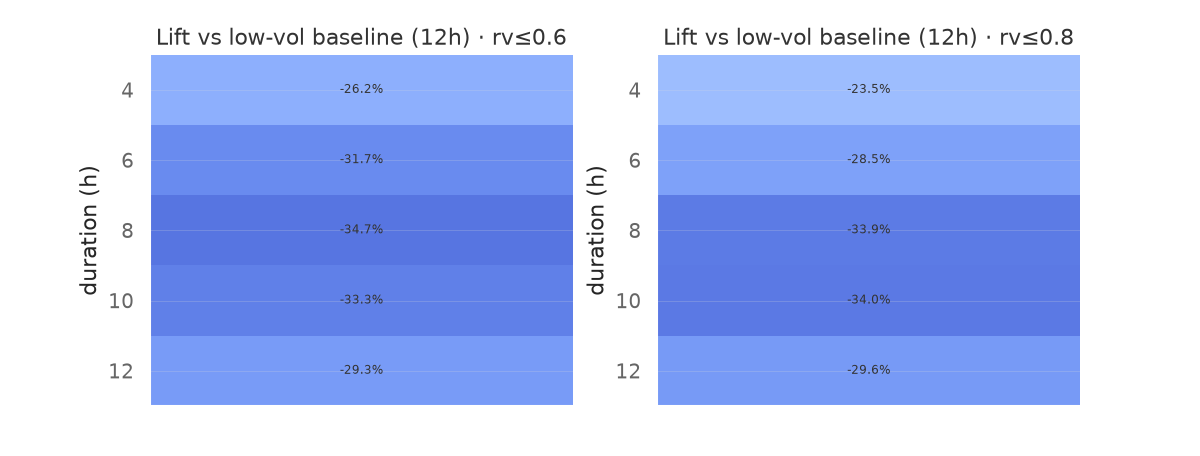
- Conclusion: the hypothesis is unsupported, and the point estimate is in the opposite direction. The pattern breaks down significantly less often than every comparator: the generic low-volatility consolidation, its sideways subset, upward drift without compression, upward drift after the same impulse, and all post-impulse consolidations. Regression controls for boundary geometry reduce but do not remove the negative pattern coefficient. The full parameter grid contains no configuration with a positive lift over either low-vol baseline at any horizon.
- Chronological stability: design-period cohort A broke down at 14.1% and validation at 19.4%; the frozen out-of-sample test window (2026-07 to 2026-09) was higher at 31.1% but the generic low-vol baseline was 45.3% in the same window, so the pattern remained below it. Against the drift-without-compression baseline the test difference was +9.3% (95% CI -5.4% to +23.8%). The level is unstable across periods and no test-window comparison shows a significant elevation.
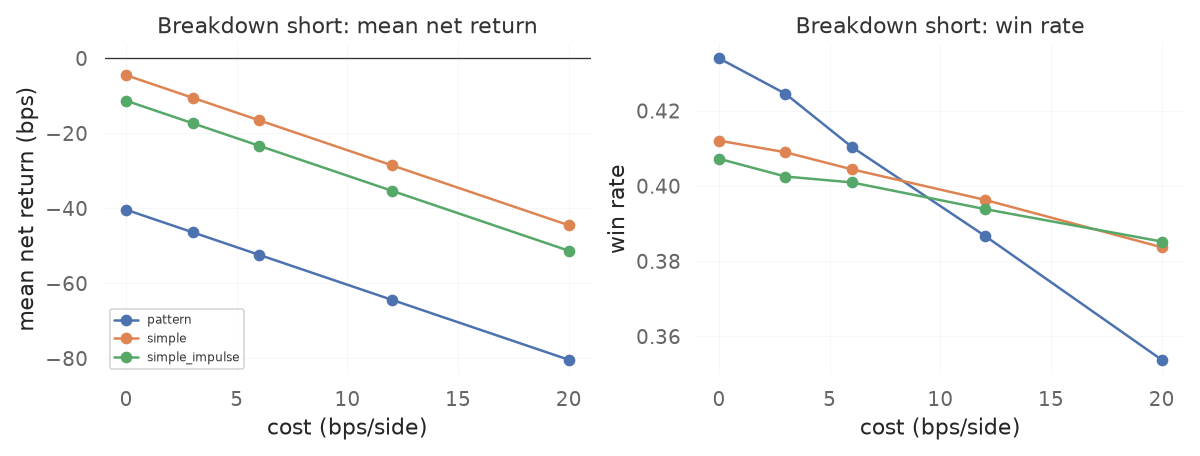
- Tradability: the short-the-breakdown strategy lost money on average at every cost level including zero (43.4% win rate, mean net return −0.40% at 0 bps/side), so even the realised breakdowns did not continue profitably.
Discipline. The primary thresholds above were fixed from the study specification before any outcome was examined. The design window (2025-01 to 2026-03) was used for diagnostics only; no threshold was selected on the validation or test windows, and the entire pre-registered grid is reported rather than its best cell. The 2026-07 to 2026-09 test window is therefore the untouched out-of-sample period.
1. Pattern definition (numeric, causal)
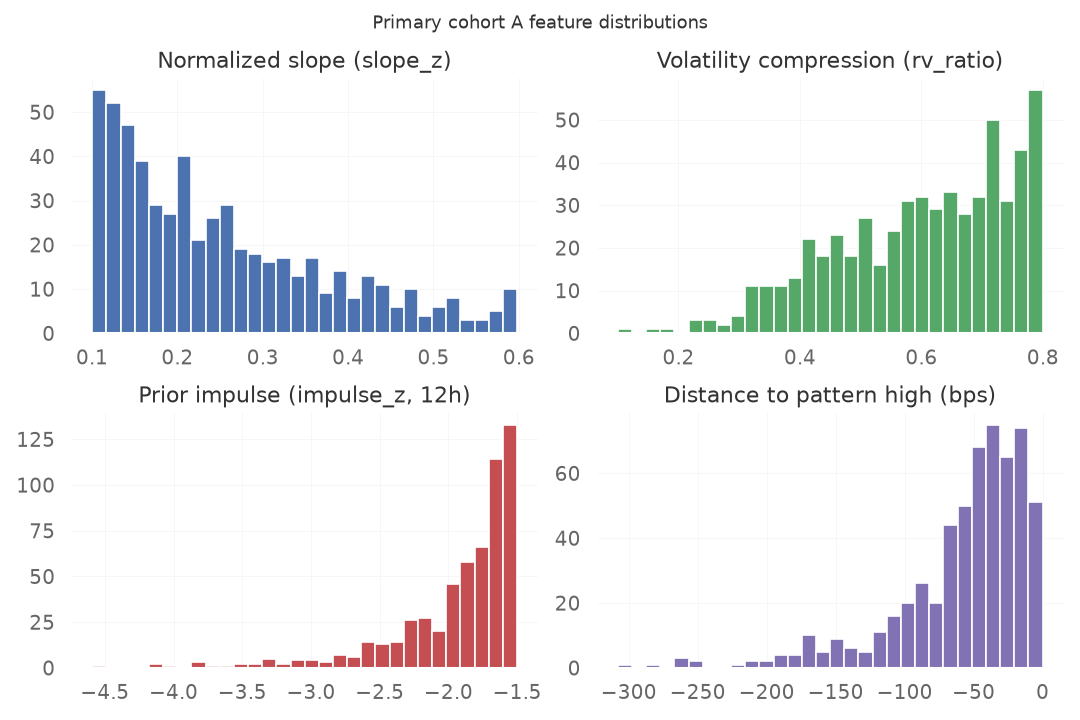
Timeframe 1h (resampled from 1m with the repository resampler). Window length 8 bars (variants [4, 6, 8, 10, 12]). For each bar t the window is t-w+1 .. t. All quantities use only closes/highs/lows at or before t.
- Upward drift: OLS slope of log close per bar, divided by the trailing 168h realized volatility of 1h log returns (
slope_z), in [0.1, 0.6]. - Low volatility: window realized volatility / trailing 168h realized volatility (
rv_ratio) ≤ 0.8. - Prior bearish impulse: 12h log return ending one bar before the window, divided by trailing volatility × sqrt(12) (
impulse_z) ≤ -1.5. The impulse is measured strictly before the consolidation. - Frozen boundaries:
pattern_high = max(high)andpattern_low = min(low)over the window; they never move after detection. - Outcome window: starts at the open of
t+1. First touch of either boundary decides. Same-hour double touches are resolved with 1m bars; same-minute touches are labelledAMBIGUOUS_SAME_BAR.

2. Data and data quality
Binance USD-M perpetual futures, 1m klines resampled to 1h, 2025-01-01 to 2026-09-30. 1m data are used for intrabar boundary ordering and the strategy test.
| symbol | n_1m | first_1m | last_1m | duplicate_1m | missing_minute_gaps | missing_minutes | null_cells_1m | n_1h | first_1h | last_1h | funding_rows |
|---|---|---|---|---|---|---|---|---|---|---|---|
| BTCUSDT | 918720 | 2025-01-01 00:00:00+00:00 | 2026-09-30 23:59:00+00:00 | 0 | 0 | 0 | 0 | 15312 | 2025-01-01 00:00:00+00:00 | 2026-09-30 23:00:00+00:00 | 1914 |
| ETHUSDT | 918720 | 2025-01-01 00:00:00+00:00 | 2026-09-30 23:59:00+00:00 | 0 | 0 | 0 | 0 | 15312 | 2025-01-01 00:00:00+00:00 | 2026-09-30 23:00:00+00:00 | 1914 |
| SOLUSDT | 918720 | 2025-01-01 00:00:00+00:00 | 2026-09-30 23:59:00+00:00 | 0 | 0 | 0 | 62218 | 15312 | 2025-01-01 00:00:00+00:00 | 2026-09-30 23:00:00+00:00 | 1914 |
| ZECUSDT | 918720 | 2025-01-01 00:00:00+00:00 | 2026-09-30 23:59:00+00:00 | 0 | 0 | 0 | 0 | 15312 | 2025-01-01 00:00:00+00:00 | 2026-09-30 23:00:00+00:00 | 1914 |
| NEARUSDT | 918720 | 2025-01-01 00:00:00+00:00 | 2026-09-30 23:59:00+00:00 | 0 | 0 | 0 | 0 | 15312 | 2025-01-01 00:00:00+00:00 | 2026-09-30 23:00:00+00:00 | 1914 |
| XRPUSDT | 918720 | 2025-01-01 00:00:00+00:00 | 2026-09-30 23:59:00+00:00 | 0 | 0 | 0 | 0 | 15312 | 2025-01-01 00:00:00+00:00 | 2026-09-30 23:00:00+00:00 | 1914 |
| OGNUSDT | 918720 | 2025-01-01 00:00:00+00:00 | 2026-09-30 23:59:00+00:00 | 0 | 0 | 0 | 0 | 15312 | 2025-01-01 00:00:00+00:00 | 2026-09-30 23:00:00+00:00 | 2567 |
| HYPEUSDT | 703530 | 2025-05-30 10:30:00+00:00 | 2026-09-30 23:59:00+00:00 | 0 | 0 | 0 | 0 | 11725 | 2025-05-30 11:00:00+00:00 | 2026-09-30 23:00:00+00:00 | 2930 |
| BNBUSDT | 918720 | 2025-01-01 00:00:00+00:00 | 2026-09-30 23:59:00+00:00 | 0 | 0 | 0 | 0 | 15312 | 2025-01-01 00:00:00+00:00 | 2026-09-30 23:00:00+00:00 | 1914 |
| DOGEUSDT | 918720 | 2025-01-01 00:00:00+00:00 | 2026-09-30 23:59:00+00:00 | 0 | 0 | 0 | 0 | 15312 | 2025-01-01 00:00:00+00:00 | 2026-09-30 23:00:00+00:00 | 1914 |
All symbols have complete 1m coverage over the research window (no duplicate timestamps, no missing-minute gaps), which is what makes intrabar boundary ordering resolvable. SOLUSDT carries 62,218 null cells in taker_buy_volume (unused here). HYPEUSDT starts 2025-05-30. Effective event start is later than the 200-bar warmup and the 168-bar volatility lookback. Across the primary cohorts only one same-minute ambiguity survives (cohort B); cohort A has none, so the 1m resolution removes essentially all censoring from the boundary race.
3. Event counts and primary results
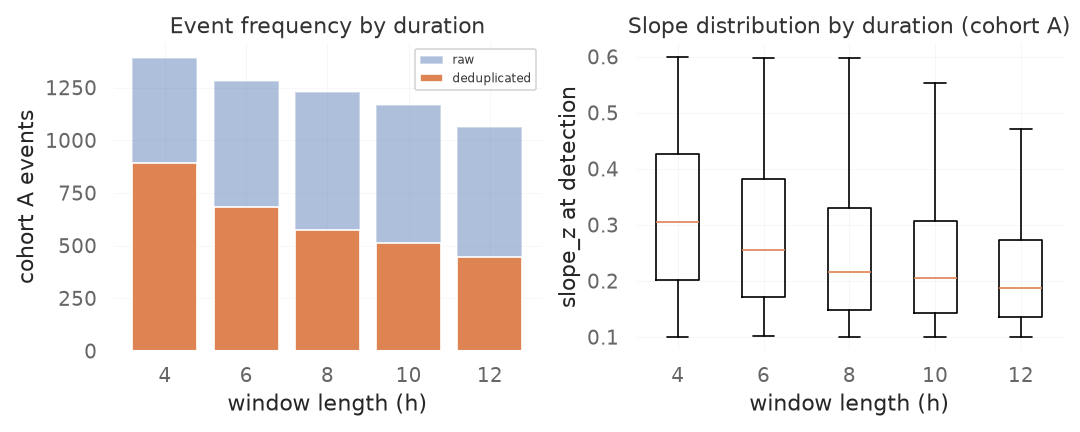
Cohort A (drift + compression + prior impulse): 575 deduplicated events (one per duration-length non-overlapping window); raw qualifying bars and cluster counts are in the table. Cohort B is the same drift/compression without a qualifying prior impulse.
Cohort A by horizon
| horizon | n_events | n_resolved | n_bd | n_bo | n_neither | n_ambiguous | n_invalid | bd_rate_resolved | bd_ci_low | bd_ci_high | bd_rate_valid | bd_valid_ci_low | bd_valid_ci_high | bo_rate_resolved | neither_rate | ambiguous_rate | fwd_mean | fwd_median | mfe_atr_mean | mae_atr_mean |
|---|---|---|---|---|---|---|---|---|---|---|---|---|---|---|---|---|---|---|---|---|
| 3.0000 | 575.0000 | 399.0000 | 41.0000 | 358.0000 | 176.0000 | 0.0000 | 0.0000 | 0.1028 | 0.0767 | 0.1364 | 0.0713 | 0.0530 | 0.0953 | 0.8972 | 0.3061 | 0.0000 | -0.0000 | 0.0005 | 0.7514 | -0.7685 |
| 6.0000 | 575.0000 | 505.0000 | 76.0000 | 429.0000 | 70.0000 | 0.0000 | 0.0000 | 0.1505 | 0.1220 | 0.1843 | 0.1322 | 0.1069 | 0.1623 | 0.8495 | 0.1217 | 0.0000 | -0.0006 | 0.0007 | 1.1163 | -1.1632 |
| 12.0000 | 575.0000 | 556.0000 | 95.0000 | 461.0000 | 19.0000 | 0.0000 | 0.0000 | 0.1709 | 0.1419 | 0.2044 | 0.1652 | 0.1371 | 0.1978 | 0.8291 | 0.0330 | 0.0000 | 0.0017 | 0.0004 | 1.7194 | -1.7663 |
| 24.0000 | 575.0000 | 572.0000 | 106.0000 | 466.0000 | 3.0000 | 0.0000 | 0.0000 | 0.1853 | 0.1556 | 0.2192 | 0.1843 | 0.1548 | 0.2181 | 0.8147 | 0.0052 | 0.0000 | 0.0033 | 0.0021 | 2.5127 | -2.6566 |
| 48.0000 | 575.0000 | 575.0000 | 108.0000 | 467.0000 | 0.0000 | 0.0000 | 0.0000 | 0.1878 | 0.1580 | 0.2218 | 0.1878 | 0.1580 | 0.2218 | 0.8122 | 0.0000 | 0.0000 | 0.0071 | 0.0053 | 3.8306 | -3.5598 |
Cohort B by horizon
| horizon | n_events | n_resolved | n_bd | n_bo | n_neither | n_ambiguous | n_invalid | bd_rate_resolved | bd_ci_low | bd_ci_high | bd_rate_valid | bd_valid_ci_low | bd_valid_ci_high | bo_rate_resolved | neither_rate | ambiguous_rate | fwd_mean | fwd_median | mfe_atr_mean | mae_atr_mean |
|---|---|---|---|---|---|---|---|---|---|---|---|---|---|---|---|---|---|---|---|---|
| 3.0000 | 6137.0000 | 4075.0000 | 526.0000 | 3549.0000 | 2061.0000 | 1.0000 | 0.0000 | 0.1291 | 0.1191 | 0.1397 | 0.0857 | 0.0790 | 0.0930 | 0.8709 | 0.3358 | 0.0002 | -0.0001 | -0.0004 | 0.9062 | -0.8849 |
| 6.0000 | 6137.0000 | 5052.0000 | 926.0000 | 4126.0000 | 1084.0000 | 1.0000 | 0.0000 | 0.1833 | 0.1729 | 0.1942 | 0.1509 | 0.1422 | 0.1601 | 0.8167 | 0.1766 | 0.0002 | 0.0001 | -0.0004 | 1.3500 | -1.3040 |
| 12.0000 | 6137.0000 | 5716.0000 | 1227.0000 | 4489.0000 | 420.0000 | 1.0000 | 0.0000 | 0.2147 | 0.2042 | 0.2255 | 0.1999 | 0.1901 | 0.2101 | 0.7853 | 0.0684 | 0.0002 | 0.0001 | -0.0003 | 1.9976 | -1.9414 |
| 24.0000 | 6137.0000 | 6046.0000 | 1383.0000 | 4663.0000 | 90.0000 | 1.0000 | 0.0000 | 0.2287 | 0.2183 | 0.2395 | 0.2254 | 0.2151 | 0.2360 | 0.7713 | 0.0147 | 0.0002 | 0.0009 | -0.0008 | 2.9755 | -2.8406 |
| 48.0000 | 6137.0000 | 6121.0000 | 1428.0000 | 4693.0000 | 15.0000 | 1.0000 | 0.0000 | 0.2333 | 0.2229 | 0.2441 | 0.2327 | 0.2223 | 0.2434 | 0.7667 | 0.0024 | 0.0002 | 0.0020 | -0.0010 | 4.4846 | -4.0777 |
4. Baseline comparisons
Baselines: A random windows matched by symbol, duration, half-year, trailing-vol quintile and prior-impulse status; B generic low-volatility consolidation (no positive-drift requirement), and its sideways subset; C upward drift without volatility compression; D upward drift with the same prior impulse but no compression; E all eligible post-impulse consolidations. Pattern events are excluded from the non-random baselines to avoid self-comparison.
| mask | n_resolved | n_bd | bd_rate_resolved | bd_ci_low | bd_ci_high |
|---|---|---|---|---|---|
| A | 556 | 95 | 0.1709 | 0.1419 | 0.2044 |
| B | 5716 | 1227 | 0.2147 | 0.2042 | 0.2255 |
| drift_no_low_vol | 5396 | 1249 | 0.2315 | 0.2204 | 0.2429 |
| impulse_drift | 506 | 133 | 0.2628 | 0.2264 | 0.3029 |
| low_vol_all | 10930 | 5572 | 0.5098 | 0.5004 | 0.5192 |
| low_vol_sideways | 6901 | 3405 | 0.4934 | 0.4816 | 0.5052 |
| post_impulse_all | 1304 | 696 | 0.5337 | 0.5066 | 0.5607 |
| random_matched | 1382 | 859 | 0.6216 | 0.5957 | 0.6468 |
Pattern − baseline differences (block bootstrap, 7-day blocks)
| baseline | n_pattern | n_baseline | pattern_bd_rate | baseline_bd_rate | abs_diff | ci_low | ci_high | rel_diff |
|---|---|---|---|---|---|---|---|---|
| low_vol_all | 556 | 10930 | 0.1709 | 0.5098 | -0.3389 | -0.3832 | -0.2927 | -0.6648 |
| low_vol_sideways | 556 | 6901 | 0.1709 | 0.4934 | -0.3225 | -0.3692 | -0.2752 | -0.6537 |
| drift_no_low_vol | 556 | 5396 | 0.1709 | 0.2315 | -0.0606 | -0.1040 | -0.0140 | -0.2618 |
| impulse_drift | 556 | 506 | 0.1709 | 0.2628 | -0.0920 | -0.1516 | -0.0282 | -0.3499 |
| post_impulse_all | 556 | 1304 | 0.1709 | 0.5337 | -0.3629 | -0.4189 | -0.3032 | -0.6799 |
| random_matched | 556 | 1382 | 0.1709 | 0.6216 | -0.4507 | -0.5273 | -0.3719 | -0.7251 |
Random-baseline match quality
Matching uses only trailing information (symbol, duration, half-year, trailing-vol quintile, prior-impulse status). Counts of match levels:
| level | events | controls |
|---|---|---|
| exact | 535 | 1605 |
Independent-event estimate
Cohort A: 1229 raw qualifying bars, 575 deduplicated events, 564 non-overlapping clusters. All inference uses the deduplicated set; the raw count is reported so overlap remains visible.
Time to first touch and post-break dynamics (cohort A)
| outcome | n | mean_t_hours | median_t_hours | mean_post_3h | mean_post_6h | mean_post_12h | mean_post_24h | reversal_within_3h | followthrough_12h |
|---|---|---|---|---|---|---|---|---|---|
| breakdown-first | 95 | 4.5684 | 4.0000 | 0.0038 | 0.0052 | 0.0124 | 0.0185 | 0.7263 | 0.3053 |
| breakout-first | 461 | 2.4490 | 1.0000 | -0.0014 | -0.0010 | -0.0013 | 0.0001 |
The post-break columns are the continuation return measured from the frozen boundary (descriptive, not a trading simulation). A positive post-breakdown value means price closed back above pattern_low; breakdowns in this sample mostly reversed (reversal within 3h 73%, 12h follow-through 31%), consistent with the negative strategy returns below.
5. Feature ablation
Cumulative conditions, 12h horizon. Adding EMA ROC/acceleration, EMA spread velocity and volume collapses the sample to single digits and is not informative.
| stage | n_dedup | n_resolved | n_bd | n_bo | bd_rate_resolved | n_neither | bd_rate_valid |
|---|---|---|---|---|---|---|---|
| 01_positive_drift_only | 10332 | 9316 | 2063 | 7253 | 0.2214 | 1015 | 0.1997 |
| 02_low_vol_only | 12595 | 11649 | 5795 | 5854 | 0.4975 | 945 | 0.4601 |
| 03_drift_plus_low_vol | 6349 | 5920 | 1262 | 4658 | 0.2132 | 428 | 0.1988 |
| 04_plus_prior_impulse | 575 | 556 | 95 | 461 | 0.1709 | 19 | 0.1652 |
| 05_plus_weak_recovery | 408 | 394 | 75 | 319 | 0.1904 | 14 | 0.1838 |
| 06_plus_ema_roc_accel | 11 | 10 | 3 | 7 | 0.3000 | 1 | 0.2727 |
| 07_plus_ema_spread_velocity | 10 | 9 | 3 | 6 | 0.3333 | 1 | 0.3000 |
| 08_plus_volume | 9 | 9 | 3 | 6 | 0.3333 | 0 | 0.3333 |
Alternative compression definitions (drift + impulse held fixed)
| variant | n_dedup | n_bd | n_bo | n_resolved | bd_rate_resolved | bd_rate_valid |
|---|---|---|---|---|---|---|
| range_atr<=2.5 | 636 | 136 | 479 | 615 | 0.2211 | 0.2211 |
| rel_volume>=1.0 | 455 | 82 | 306 | 388 | 0.2113 | 0.2113 |
| atr_ratio<=0.80 | 69 | 14 | 53 | 67 | 0.2090 | 0.2090 |
| rel_volume<=1.0 | 907 | 177 | 683 | 860 | 0.2058 | 0.2058 |
| body_ratio<=0.50 | 999 | 190 | 735 | 925 | 0.2054 | 0.2054 |
| mean_tr_atr<=1.0 | 649 | 115 | 509 | 624 | 0.1843 | 0.1843 |
| rv_ratio<=0.80 | 575 | 95 | 461 | 556 | 0.1709 | 0.1709 |
| rv_ratio<=0.60 | 319 | 49 | 262 | 311 | 0.1576 | 0.1576 |
Alternative prior-impulse definitions
| impulse_definition | n_dedup | n_resolved | n_bd | bd_rate_resolved |
|---|---|---|---|---|
| ret_6h<=-0.05 | 194 | 182 | 47 | 0.2582 |
| dd_6h<=-0.02 | 2223 | 2072 | 454 | 0.2191 |
| atrdisp_6h<=-3 | 329 | 306 | 67 | 0.2190 |
| z_6h<=-2 | 263 | 252 | 55 | 0.2183 |
| z_24h<=-2 | 166 | 156 | 34 | 0.2179 |
| atrdisp_6h<=-1 | 2263 | 2112 | 454 | 0.2150 |
| dd_12h<=-0.02 | 3041 | 2840 | 607 | 0.2137 |
| z_12h<=-2 | 229 | 223 | 47 | 0.2108 |
| dd_3h<=-0.02 | 1502 | 1395 | 293 | 0.2100 |
| dd_24h<=-0.02 | 3906 | 3633 | 754 | 0.2075 |
| atrdisp_12h<=-1 | 2628 | 2463 | 506 | 0.2054 |
| ret_6h<=-0.02 | 1280 | 1196 | 245 | 0.2048 |
| dd_6h<=-0.05 | 328 | 310 | 63 | 0.2032 |
| dd_12h<=-0.03 | 1889 | 1773 | 357 | 0.2014 |
| dd_24h<=-0.05 | 1436 | 1343 | 269 | 0.2003 |
| atrdisp_3h<=-1 | 1858 | 1730 | 344 | 0.1988 |
| atrdisp_24h<=-2 | 1999 | 1856 | 365 | 0.1967 |
| ret_12h<=-0.02 | 1747 | 1643 | 321 | 0.1954 |
| ret_6h<=-0.03 | 658 | 612 | 119 | 0.1944 |
| dd_12h<=-0.05 | 735 | 695 | 135 | 0.1942 |
| dd_6h<=-0.03 | 1151 | 1071 | 208 | 0.1942 |
| atrdisp_24h<=-3 | 1242 | 1154 | 224 | 0.1941 |
| dd_24h<=-0.03 | 2764 | 2566 | 498 | 0.1941 |
| ret_24h<=-0.05 | 730 | 681 | 131 | 0.1924 |
| z_3h<=-1 | 1549 | 1435 | 276 | 0.1923 |
| z_6h<=-1 | 1337 | 1248 | 240 | 0.1923 |
| ret_12h<=-0.03 | 1122 | 1056 | 202 | 0.1913 |
| atrdisp_24h<=-1 | 2891 | 2677 | 511 | 0.1909 |
| atrdisp_12h<=-2 | 1510 | 1426 | 271 | 0.1900 |
| z_24h<=-1 | 1137 | 1050 | 197 | 0.1876 |
| ret_24h<=-0.03 | 1512 | 1413 | 264 | 0.1868 |
| atrdisp_6h<=-2 | 929 | 860 | 160 | 0.1860 |
| ret_3h<=-0.02 | 876 | 819 | 152 | 0.1856 |
| z_6h<=-1.5 | 608 | 574 | 106 | 0.1847 |
| dd_3h<=-0.03 | 663 | 618 | 114 | 0.1845 |
| ret_24h<=-0.02 | 2166 | 2013 | 371 | 0.1843 |
| dd_3h<=-0.05 | 143 | 136 | 25 | 0.1838 |
| z_12h<=-1 | 1260 | 1202 | 220 | 0.1830 |
| ret_12h<=-0.05 | 419 | 400 | 73 | 0.1825 |
| z_24h<=-1.5 | 466 | 439 | 80 | 0.1822 |
| atrdisp_12h<=-3 | 753 | 712 | 129 | 0.1812 |
| z_3h<=-1.5 | 734 | 685 | 122 | 0.1781 |
| atrdisp_3h<=-2 | 489 | 458 | 81 | 0.1769 |
| ret_3h<=-0.03 | 369 | 341 | 60 | 0.1760 |
| z_12h<=-1.5 | 575 | 556 | 95 | 0.1709 |
| z_3h<=-2 | 350 | 326 | 55 | 0.1687 |
| atrdisp_3h<=-3 | 141 | 132 | 22 | 0.1667 |
| ret_3h<=-0.05 | 84 | 82 | 10 | 0.1220 |
Alternative volatility / ATR lookbacks (primary parameters)
| vol_lookback | atr_period | eligible_bars | n_dedup | n_bd | n_bo | n_resolved | bd_rate_resolved |
|---|---|---|---|---|---|---|---|
| 72.0000 | 7.0000 | 147053.0000 | 618.0000 | 102.0000 | 492.0000 | 594.0000 | 0.1717 |
| 168.0000 | 7.0000 | 147053.0000 | 575.0000 | 95.0000 | 461.0000 | 556.0000 | 0.1709 |
| 168.0000 | 14.0000 | 147053.0000 | 575.0000 | 95.0000 | 461.0000 | 556.0000 | 0.1709 |
| 168.0000 | 28.0000 | 147053.0000 | 575.0000 | 95.0000 | 461.0000 | 556.0000 | 0.1709 |
| 720.0000 | 14.0000 | 141773.0000 | 456.0000 | 71.0000 | 361.0000 | 432.0000 | 0.1644 |
6. Per-symbol, per-regime and per-period
Per symbol (12h)
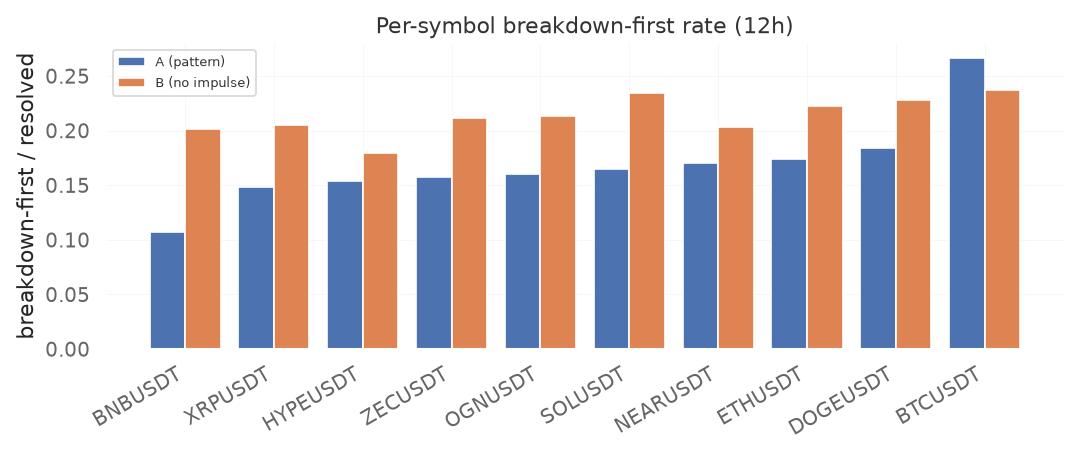
| symbol | n | n_bd | n_bo | n_neither | n_ambiguous | n_resolved | bd_rate_resolved | bd_ci_low | bd_ci_high | horizon | n_B | n_bd_B | n_bo_B | n_neither_B | n_ambiguous_B | n_resolved_B | bd_rate_resolved_B | bd_ci_low_B | bd_ci_high_B |
|---|---|---|---|---|---|---|---|---|---|---|---|---|---|---|---|---|---|---|---|
| BNBUSDT | 57 | 6.0000 | 50.0000 | 1.0000 | 0.0000 | 56.0000 | 0.1071 | 0.0500 | 0.2147 | 12 | 702 | 132.0000 | 524.0000 | 46.0000 | 0.0000 | 656.0000 | 0.2012 | 0.1723 | 0.2336 |
| BTCUSDT | 64 | 16.0000 | 44.0000 | 4.0000 | 0.0000 | 60.0000 | 0.2667 | 0.1713 | 0.3901 | 12 | 650 | 143.0000 | 459.0000 | 48.0000 | 0.0000 | 602.0000 | 0.2375 | 0.2053 | 0.2731 |
| DOGEUSDT | 77 | 14.0000 | 62.0000 | 1.0000 | 0.0000 | 76.0000 | 0.1842 | 0.1130 | 0.2858 | 12 | 634 | 135.0000 | 458.0000 | 41.0000 | 0.0000 | 593.0000 | 0.2277 | 0.1957 | 0.2631 |
| ETHUSDT | 73 | 12.0000 | 57.0000 | 4.0000 | 0.0000 | 69.0000 | 0.1739 | 0.1024 | 0.2798 | 12 | 681 | 138.0000 | 481.0000 | 62.0000 | 0.0000 | 619.0000 | 0.2229 | 0.1919 | 0.2574 |
| HYPEUSDT | 40 | 6.0000 | 33.0000 | 1.0000 | 0.0000 | 39.0000 | 0.1538 | 0.0725 | 0.2973 | 12 | 456 | 79.0000 | 361.0000 | 16.0000 | 0.0000 | 440.0000 | 0.1795 | 0.1465 | 0.2181 |
| NEARUSDT | 43 | 7.0000 | 34.0000 | 2.0000 | 0.0000 | 41.0000 | 0.1707 | 0.0853 | 0.3126 | 12 | 550 | 105.0000 | 412.0000 | 33.0000 | 0.0000 | 517.0000 | 0.2031 | 0.1707 | 0.2399 |
| OGNUSDT | 51 | 8.0000 | 42.0000 | 1.0000 | 0.0000 | 50.0000 | 0.1600 | 0.0834 | 0.2851 | 12 | 646 | 129.0000 | 476.0000 | 41.0000 | 0.0000 | 605.0000 | 0.2132 | 0.1824 | 0.2476 |
| SOLUSDT | 74 | 12.0000 | 61.0000 | 1.0000 | 0.0000 | 73.0000 | 0.1644 | 0.0966 | 0.2657 | 12 | 630 | 138.0000 | 451.0000 | 41.0000 | 0.0000 | 589.0000 | 0.2343 | 0.2019 | 0.2702 |
| XRPUSDT | 55 | 8.0000 | 46.0000 | 1.0000 | 0.0000 | 54.0000 | 0.1481 | 0.0770 | 0.2660 | 12 | 618 | 117.0000 | 453.0000 | 47.0000 | 1.0000 | 570.0000 | 0.2053 | 0.1741 | 0.2403 |
| ZECUSDT | 41 | 6.0000 | 32.0000 | 3.0000 | 0.0000 | 38.0000 | 0.1579 | 0.0744 | 0.3042 | 12 | 570 | 111.0000 | 414.0000 | 45.0000 | 0.0000 | 525.0000 | 0.2114 | 0.1787 | 0.2484 |
Per regime (12h)
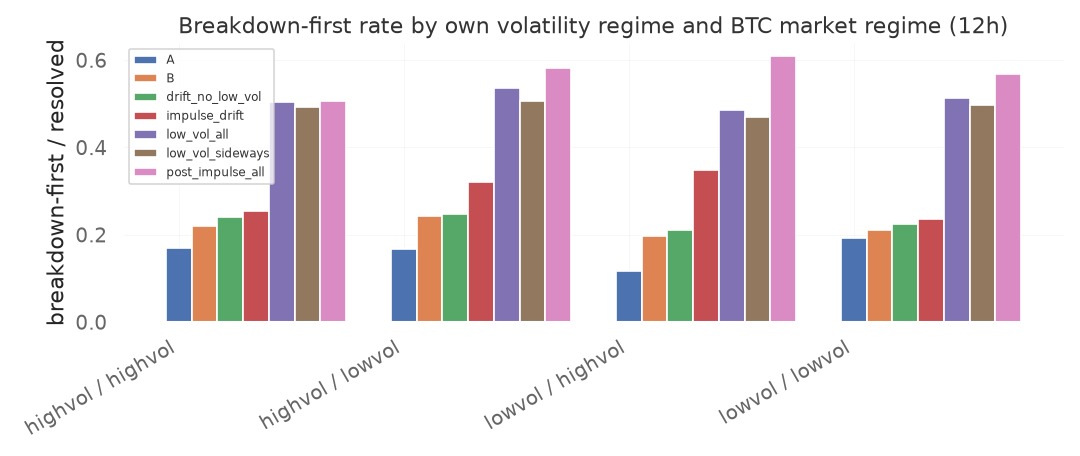
| group | regime_vol | market_regime | n | n_bd | n_bo | n_neither | n_ambiguous | n_resolved | bd_rate_resolved | bd_ci_low | bd_ci_high | horizon |
|---|---|---|---|---|---|---|---|---|---|---|---|---|
| A | highvol | highvol | 332 | 55.0000 | 269.0000 | 8.0000 | 0.0000 | 324.0000 | 0.1698 | 0.1328 | 0.2144 | 12 |
| A | highvol | lowvol | 55 | 9.0000 | 45.0000 | 1.0000 | 0.0000 | 54.0000 | 0.1667 | 0.0902 | 0.2874 | 12 |
| A | lowvol | highvol | 46 | 5.0000 | 38.0000 | 3.0000 | 0.0000 | 43.0000 | 0.1163 | 0.0507 | 0.2448 | 12 |
| A | lowvol | lowvol | 142 | 26.0000 | 109.0000 | 7.0000 | 0.0000 | 135.0000 | 0.1926 | 0.1350 | 0.2672 | 12 |
| B | highvol | highvol | 1904 | 380.0000 | 1341.0000 | 183.0000 | 0.0000 | 1721.0000 | 0.2208 | 0.2018 | 0.2410 | 12 |
| B | highvol | lowvol | 515 | 116.0000 | 361.0000 | 38.0000 | 0.0000 | 477.0000 | 0.2432 | 0.2068 | 0.2836 | 12 |
| B | lowvol | highvol | 728 | 136.0000 | 554.0000 | 38.0000 | 0.0000 | 690.0000 | 0.1971 | 0.1691 | 0.2284 | 12 |
| B | lowvol | lowvol | 2990 | 595.0000 | 2233.0000 | 161.0000 | 1.0000 | 2828.0000 | 0.2104 | 0.1958 | 0.2258 | 12 |
| low_vol_all | highvol | highvol | 3540 | 1607.0000 | 1580.0000 | 353.0000 | 0.0000 | 3187.0000 | 0.5042 | 0.4869 | 0.5216 | 12 |
| low_vol_all | highvol | lowvol | 1054 | 517.0000 | 446.0000 | 91.0000 | 0.0000 | 963.0000 | 0.5369 | 0.5053 | 0.5681 | 12 |
| low_vol_all | lowvol | highvol | 1334 | 611.0000 | 650.0000 | 73.0000 | 0.0000 | 1261.0000 | 0.4845 | 0.4570 | 0.5121 | 12 |
| low_vol_all | lowvol | lowvol | 5853 | 2835.0000 | 2681.0000 | 336.0000 | 1.0000 | 5516.0000 | 0.5140 | 0.5008 | 0.5271 | 12 |
| low_vol_sideways | highvol | highvol | 2022 | 915.0000 | 944.0000 | 163.0000 | 0.0000 | 1859.0000 | 0.4922 | 0.4695 | 0.5149 | 12 |
| low_vol_sideways | highvol | lowvol | 589 | 279.0000 | 272.0000 | 38.0000 | 0.0000 | 551.0000 | 0.5064 | 0.4647 | 0.5479 | 12 |
| low_vol_sideways | lowvol | highvol | 824 | 366.0000 | 415.0000 | 43.0000 | 0.0000 | 781.0000 | 0.4686 | 0.4339 | 0.5037 | 12 |
| low_vol_sideways | lowvol | lowvol | 3890 | 1845.0000 | 1864.0000 | 181.0000 | 0.0000 | 3709.0000 | 0.4974 | 0.4814 | 0.5135 | 12 |
| drift_no_low_vol | highvol | highvol | 2677 | 535.0000 | 1695.0000 | 447.0000 | 0.0000 | 2230.0000 | 0.2399 | 0.2226 | 0.2581 | 12 |
| drift_no_low_vol | highvol | lowvol | 702 | 151.0000 | 462.0000 | 89.0000 | 0.0000 | 613.0000 | 0.2463 | 0.2139 | 0.2819 | 12 |
| drift_no_low_vol | lowvol | highvol | 650 | 125.0000 | 471.0000 | 54.0000 | 0.0000 | 596.0000 | 0.2097 | 0.1790 | 0.2442 | 12 |
| drift_no_low_vol | lowvol | lowvol | 2126 | 438.0000 | 1519.0000 | 169.0000 | 0.0000 | 1957.0000 | 0.2238 | 0.2059 | 0.2428 | 12 |
| impulse_drift | highvol | highvol | 427 | 95.0000 | 280.0000 | 52.0000 | 0.0000 | 375.0000 | 0.2533 | 0.2120 | 0.2997 | 12 |
| impulse_drift | highvol | lowvol | 61 | 17.0000 | 36.0000 | 8.0000 | 0.0000 | 53.0000 | 0.3208 | 0.2109 | 0.4548 | 12 |
| impulse_drift | lowvol | highvol | 24 | 8.0000 | 15.0000 | 1.0000 | 0.0000 | 23.0000 | 0.3478 | 0.1881 | 0.5511 | 12 |
| impulse_drift | lowvol | lowvol | 59 | 13.0000 | 42.0000 | 4.0000 | 0.0000 | 55.0000 | 0.2364 | 0.1437 | 0.3635 | 12 |
| post_impulse_all | highvol | highvol | 962 | 414.0000 | 404.0000 | 144.0000 | 0.0000 | 818.0000 | 0.5061 | 0.4719 | 0.5403 | 12 |
| post_impulse_all | highvol | lowvol | 174 | 89.0000 | 64.0000 | 21.0000 | 0.0000 | 153.0000 | 0.5817 | 0.5025 | 0.6569 | 12 |
| post_impulse_all | lowvol | highvol | 103 | 59.0000 | 38.0000 | 6.0000 | 0.0000 | 97.0000 | 0.6082 | 0.5088 | 0.6995 | 12 |
| post_impulse_all | lowvol | lowvol | 249 | 134.0000 | 102.0000 | 13.0000 | 0.0000 | 236.0000 | 0.5678 | 0.5040 | 0.6294 | 12 |
Chronological design / validation / test (12h)
| group | split | n | n_bd | n_bo | n_neither | n_ambiguous | n_resolved | bd_rate_resolved | bd_ci_low | bd_ci_high | horizon |
|---|---|---|---|---|---|---|---|---|---|---|---|
| A | design | 423 | 58.0000 | 352.0000 | 13.0000 | 0.0000 | 410.0000 | 0.1415 | 0.1111 | 0.1785 | 12 |
| A | test | 75 | 23.0000 | 51.0000 | 1.0000 | 0.0000 | 74.0000 | 0.3108 | 0.2169 | 0.4234 | 12 |
| A | validation | 77 | 14.0000 | 58.0000 | 5.0000 | 0.0000 | 72.0000 | 0.1944 | 0.1195 | 0.3003 | 12 |
| B | design | 4287 | 839.0000 | 3161.0000 | 286.0000 | 1.0000 | 4000.0000 | 0.2097 | 0.1974 | 0.2226 | 12 |
| B | test | 946 | 169.0000 | 712.0000 | 65.0000 | 0.0000 | 881.0000 | 0.1918 | 0.1672 | 0.2191 | 12 |
| B | validation | 904 | 219.0000 | 616.0000 | 69.0000 | 0.0000 | 835.0000 | 0.2623 | 0.2336 | 0.2932 | 12 |
| low_vol_all | design | 8241 | 3960.0000 | 3722.0000 | 558.0000 | 1.0000 | 7682.0000 | 0.5155 | 0.5043 | 0.5267 | 12 |
| low_vol_all | test | 1779 | 736.0000 | 888.0000 | 155.0000 | 0.0000 | 1624.0000 | 0.4532 | 0.4291 | 0.4775 | 12 |
| low_vol_all | validation | 1764 | 876.0000 | 748.0000 | 140.0000 | 0.0000 | 1624.0000 | 0.5394 | 0.5151 | 0.5635 | 12 |
| low_vol_sideways | design | 5073 | 2414.0000 | 2379.0000 | 280.0000 | 0.0000 | 4793.0000 | 0.5037 | 0.4895 | 0.5178 | 12 |
| low_vol_sideways | test | 1121 | 448.0000 | 593.0000 | 80.0000 | 0.0000 | 1041.0000 | 0.4304 | 0.4006 | 0.4606 | 12 |
| low_vol_sideways | validation | 1132 | 543.0000 | 524.0000 | 65.0000 | 0.0000 | 1067.0000 | 0.5089 | 0.4789 | 0.5388 | 12 |
| drift_no_low_vol | design | 4305 | 891.0000 | 2913.0000 | 501.0000 | 0.0000 | 3804.0000 | 0.2342 | 0.2210 | 0.2479 | 12 |
| drift_no_low_vol | test | 923 | 176.0000 | 633.0000 | 114.0000 | 0.0000 | 809.0000 | 0.2176 | 0.1905 | 0.2473 | 12 |
| drift_no_low_vol | validation | 927 | 182.0000 | 601.0000 | 144.0000 | 0.0000 | 783.0000 | 0.2324 | 0.2042 | 0.2633 | 12 |
| impulse_drift | design | 430 | 93.0000 | 292.0000 | 45.0000 | 0.0000 | 385.0000 | 0.2416 | 0.2015 | 0.2867 | 12 |
| impulse_drift | test | 47 | 11.0000 | 25.0000 | 11.0000 | 0.0000 | 36.0000 | 0.3056 | 0.1800 | 0.4686 | 12 |
| impulse_drift | validation | 94 | 29.0000 | 56.0000 | 9.0000 | 0.0000 | 85.0000 | 0.3412 | 0.2492 | 0.4469 | 12 |
| post_impulse_all | design | 1087 | 505.0000 | 449.0000 | 133.0000 | 0.0000 | 954.0000 | 0.5294 | 0.4976 | 0.5608 | 12 |
| post_impulse_all | test | 150 | 65.0000 | 66.0000 | 19.0000 | 0.0000 | 131.0000 | 0.4962 | 0.4119 | 0.5807 | 12 |
| post_impulse_all | validation | 251 | 126.0000 | 93.0000 | 32.0000 | 0.0000 | 219.0000 | 0.5753 | 0.5091 | 0.6390 | 12 |
Pattern − baseline differences by split
Resolved-event rates and 7-day block-bootstrap intervals within each chronological window. The test window is the untouched out-of-sample period.
| split | baseline | n_pattern | n_baseline | pattern_bd_rate | baseline_bd_rate | abs_diff | ci_low | ci_high |
|---|---|---|---|---|---|---|---|---|
| design | low_vol_all | 410 | 7682 | 0.1415 | 0.5155 | -0.3740 | -0.4249 | -0.3158 |
| design | drift_no_low_vol | 410 | 3804 | 0.1415 | 0.2342 | -0.0928 | -0.1425 | -0.0316 |
| design | impulse_drift | 410 | 385 | 0.1415 | 0.2416 | -0.1001 | -0.1788 | -0.0210 |
| design | post_impulse_all | 410 | 954 | 0.1415 | 0.5294 | -0.3879 | -0.4591 | -0.3107 |
| validation | low_vol_all | 72 | 1624 | 0.1944 | 0.5394 | -0.3450 | -0.4504 | -0.2371 |
| validation | drift_no_low_vol | 72 | 783 | 0.1944 | 0.2324 | -0.0380 | -0.1425 | 0.0635 |
| validation | impulse_drift | 72 | 85 | 0.1944 | 0.3412 | -0.1467 | -0.3073 | -0.0122 |
| validation | post_impulse_all | 72 | 219 | 0.1944 | 0.5753 | -0.3809 | -0.5181 | -0.2506 |
| test | low_vol_all | 74 | 1624 | 0.3108 | 0.4532 | -0.1424 | -0.2812 | -0.0143 |
| test | drift_no_low_vol | 74 | 809 | 0.3108 | 0.2176 | 0.0933 | -0.0537 | 0.2380 |
| test | impulse_drift | 74 | 36 | 0.3108 | 0.3056 | 0.0053 | -0.3143 | 0.2425 |
| test | post_impulse_all | 74 | 131 | 0.3108 | 0.4962 | -0.1854 | -0.3042 | -0.0336 |
7. Parameter sensitivity
Full predefined grid: 2700 rows (540 configurations at 12h). Configurations with a positive lift versus the generic low-vol baseline: 0; versus the sideways low-vol baseline: 0. The best 12h cell still breaks down at 33.8% versus a baseline around 51%.
| duration | slope_min | slope_max | vol_ratio_max | impulse_z_max | n_resolved | bd_rate_resolved | base_bd_rate | lift | side_bd_rate | lift_vs_sideways | p_value | q_value |
|---|---|---|---|---|---|---|---|---|---|---|---|---|
| 8.0000 | 0.1000 | 0.4000 | 0.8000 | -1.5000 | 495.0000 | 0.1859 | 0.5098 | -0.3239 | 0.4934 | -0.3075 | 0.0000 | 0.0000 |
| 8.0000 | 0.1000 | 0.6000 | 0.8000 | -1.5000 | 556.0000 | 0.1709 | 0.5098 | -0.3389 | 0.4934 | -0.3225 | 0.0000 | 0.0000 |
| 8.0000 | 0.1000 | 1.0000 | 0.8000 | -1.5000 | 575.0000 | 0.1670 | 0.5098 | -0.3428 | 0.4934 | -0.3265 | 0.0000 | 0.0000 |
8. Walk-forward validation
The frozen rows apply the pre-registered 8h definition every month. The walk_forward_selected rows choose, at the start of each month, the duration with the best lift over the low-vol baseline in all prior months and apply it to the next month. This is a genuine out-of-sample selection exercise; it is not used to choose the reported primary definition.
| month | selected_duration | method | n_A | bd_A | n_base | bd_base | lift | train_lift |
|---|---|---|---|---|---|---|---|---|
| 2025-07 | 8 | frozen | 30 | 0.1333 | 530 | 0.4321 | -0.2987 | |
| 2025-08 | 8 | frozen | 35 | 0.2000 | 567 | 0.4409 | -0.2409 | |
| 2025-09 | 8 | frozen | 19 | 0.1579 | 579 | 0.4611 | -0.3032 | |
| 2025-10 | 8 | frozen | 35 | 0.2000 | 576 | 0.4167 | -0.2167 | |
| 2025-11 | 8 | frozen | 25 | 0.2400 | 594 | 0.4832 | -0.2432 | |
| 2025-12 | 8 | frozen | 40 | 0.1500 | 635 | 0.4866 | -0.3366 | |
| 2026-01 | 8 | frozen | 30 | 0.1000 | 575 | 0.4887 | -0.3887 | |
| 2026-02 | 8 | frozen | 24 | 0.2500 | 547 | 0.5283 | -0.2783 | |
| 2026-03 | 8 | frozen | 33 | 0.2424 | 603 | 0.5655 | -0.3231 | |
| 2026-04 | 8 | frozen | 29 | 0.0690 | 594 | 0.4714 | -0.4024 | |
| 2026-05 | 8 | frozen | 25 | 0.2800 | 590 | 0.4780 | -0.1980 | |
| 2026-06 | 8 | frozen | 23 | 0.2174 | 580 | 0.5414 | -0.3240 | |
| 2026-07 | 8 | frozen | 25 | 0.3600 | 611 | 0.4092 | -0.0492 | |
| 2026-08 | 8 | frozen | 24 | 0.2083 | 629 | 0.3847 | -0.1764 | |
| 2026-09 | 8 | frozen | 26 | 0.3462 | 539 | 0.4527 | -0.1065 | |
| 2026-01 | 4 | walk_forward_selected | 68 | 0.3088 | 1310 | 0.5092 | -0.2003 | -0.2500 |
| 2026-02 | 4 | walk_forward_selected | 38 | 0.3158 | 1237 | 0.5198 | -0.2040 | -0.2425 |
| 2026-03 | 4 | walk_forward_selected | 56 | 0.3750 | 1381 | 0.5460 | -0.1710 | -0.2402 |
| 2026-04 | 4 | walk_forward_selected | 45 | 0.2889 | 1343 | 0.4974 | -0.2085 | -0.2331 |
| 2026-05 | 4 | walk_forward_selected | 61 | 0.2951 | 1315 | 0.4913 | -0.1962 | -0.2315 |
| 2026-06 | 4 | walk_forward_selected | 42 | 0.1667 | 1324 | 0.5514 | -0.3847 | -0.2286 |
| 2026-07 | 4 | walk_forward_selected | 42 | 0.3333 | 1392 | 0.4576 | -0.1243 | -0.2372 |
| 2026-08 | 4 | walk_forward_selected | 29 | 0.1724 | 1401 | 0.4418 | -0.2694 | -0.2312 |
| 2026-09 | 4 | walk_forward_selected | 38 | 0.3158 | 1232 | 0.4627 | -0.1469 | -0.2315 |
9. Regression controls
Linear probability model of breakdown-first on a pattern indicator plus boundary geometry (dist_high, dist_low), volatility compression, slope and impulse, with month-clustered standard errors. This asks whether pattern membership predicts breakdown beyond boundary geometry and the post-selloff environment.
{ "n": 1860.0, "coef_is_pattern": -0.22977343396220254, "ci_low": -0.2958815437355074, "ci_high": -0.16366532418889768, "p_value": 9.60568144834849e-12, "lowvol_n": 11486.0, "lowvol_coef_is_pattern": -0.08180384289025826, "lowvol_ci_low": -0.13693680668305305, "lowvol_ci_high": -0.026670879097463462, "lowvol_p_value": 0.003636233090811668 }
10. Optional strategy after costs
Pre-specified short at a confirmed breakdown below pattern_low, entry at the next 1m open, stop at pattern_high, 1.5R target, 12h time exit, costs of 0/3/6/12/20 bps per side plus realized funding. The comparison arm is a plain prior-12h-low breakdown with the same exits (simple), and one restricted to post-selloff environments (simple_impulse).
| n | cost_bps | win_rate | mean_return | median_return | total_return | profit_factor | max_drawdown | avg_holding_hours | pct_stopped | pct_target | tag |
|---|---|---|---|---|---|---|---|---|---|---|---|
| 212.0000 | 0.0000 | 0.4340 | -0.0040 | -0.0030 | -0.8560 | 0.6211 | 1.0383 | 4.6977 | 0.2453 | 0.1038 | pattern |
| 212.0000 | 3.0000 | 0.4245 | -0.0046 | -0.0036 | -0.9832 | 0.5783 | 1.1161 | 4.6977 | 0.2453 | 0.1038 | pattern |
| 212.0000 | 6.0000 | 0.4104 | -0.0052 | -0.0042 | -1.1104 | 0.5384 | 1.1983 | 4.6977 | 0.2453 | 0.1038 | pattern |
| 212.0000 | 12.0000 | 0.3868 | -0.0064 | -0.0054 | -1.3648 | 0.4667 | 1.4087 | 4.6977 | 0.2453 | 0.1038 | pattern |
| 212.0000 | 20.0000 | 0.3538 | -0.0080 | -0.0070 | -1.7040 | 0.3853 | 1.7381 | 4.6977 | 0.2453 | 0.1038 | pattern |
| 4196.0000 | 0.0000 | 0.4121 | -0.0005 | -0.0049 | -1.8948 | 0.9426 | 3.6259 | 4.7251 | 0.5126 | 0.3263 | simple |
| 4196.0000 | 3.0000 | 0.4090 | -0.0011 | -0.0055 | -4.4124 | 0.8722 | 5.3611 | 4.7251 | 0.5126 | 0.3263 | simple |
| 4196.0000 | 6.0000 | 0.4044 | -0.0017 | -0.0061 | -6.9300 | 0.8076 | 7.1189 | 4.7251 | 0.5126 | 0.3263 | simple |
| 4196.0000 | 12.0000 | 0.3963 | -0.0029 | -0.0073 | -11.9652 | 0.6935 | 12.0463 | 4.7251 | 0.5126 | 0.3263 | simple |
| 4196.0000 | 20.0000 | 0.3837 | -0.0045 | -0.0089 | -18.6788 | 0.5669 | 18.7173 | 4.7251 | 0.5126 | 0.3263 | simple |
| 1272.0000 | 0.0000 | 0.4072 | -0.0011 | -0.0089 | -1.4386 | 0.9083 | 2.2628 | 5.7151 | 0.4780 | 0.2854 | simple_impulse |
| 1272.0000 | 3.0000 | 0.4025 | -0.0017 | -0.0095 | -2.2018 | 0.8636 | 2.7568 | 5.7151 | 0.4780 | 0.2854 | simple_impulse |
| 1272.0000 | 6.0000 | 0.4009 | -0.0023 | -0.0101 | -2.9650 | 0.8214 | 3.3796 | 5.7151 | 0.4780 | 0.2854 | simple_impulse |
| 1272.0000 | 12.0000 | 0.3939 | -0.0035 | -0.0113 | -4.4914 | 0.7437 | 4.7054 | 5.7151 | 0.4780 | 0.2854 | simple_impulse |
| 1272.0000 | 20.0000 | 0.3852 | -0.0051 | -0.0129 | -6.5266 | 0.6522 | 6.6324 | 5.7151 | 0.4780 | 0.2854 | simple_impulse |
11. Limitations
- The pattern is one of many possible low-volatility drift definitions; the grid covers the pre-registered axes but not every possible normalization.
- Overlapping windows create dependent events. Counts are reported raw and deduplicated, and uncertainty uses 7-day block bootstrap, but single-symbol confidence intervals remain approximate.
- Boundary geometry is intrinsic to the pattern. The regression controls for it, but the matched random baseline matches only on the pre-registered strata.
- The chronological test window (2026-07 to 2026-09) shows a higher cohort-A rate than the design window, but it is still below the generic low-vol baseline and its difference versus the drift-only baseline has a confidence interval spanning zero. The instability is itself evidence against a stable effect.
- The optional strategy is exploratory and secondary; it is not optimized and its sample is far smaller than the event study.
Verdict: UNSUPPORTED
Primary cohort A: 95/556 resolved events broke down first within 12h (17.1%, 95% CI 14.2%–20.4%). Generic low-vol consolidation baseline broke down at 51.0%; difference -33.9% (95% CI -38.3% to -29.3%). The hypothesis is supported only if cohort A's breakdown-first rate is materially above the comparable baselines with a confidence interval that excludes zero.
Artifacts and reproduction
All machine-readable outputs are under experiments/reports/lowvol_grind_v1/: config.json, data_quality.parquet, events_cohort_a.parquet, events_cohort_b.parquet, events_baseline_*.parquet, summary_*.parquet, baseline_diffs.parquet, split_diffs.parquet, ablation.parquet, sensitivity_grid.parquet, compression_variants.parquet, impulse_variants.parquet, lookback_sweep.parquet, by_symbol.parquet, by_regime.parquet, by_split.parquet, walk_forward.parquet, regression.json, strategy_summary.parquet, summary.json and figures/.
Reproduce with:
python scripts/lowvol_grind_study.py